Statistiques et analyses
Vois exactement qui a consulté ton flipbook, depuis où, sur quel appareil et pendant combien de temps — statistiques au niveau des pages et analyses
Aperçu
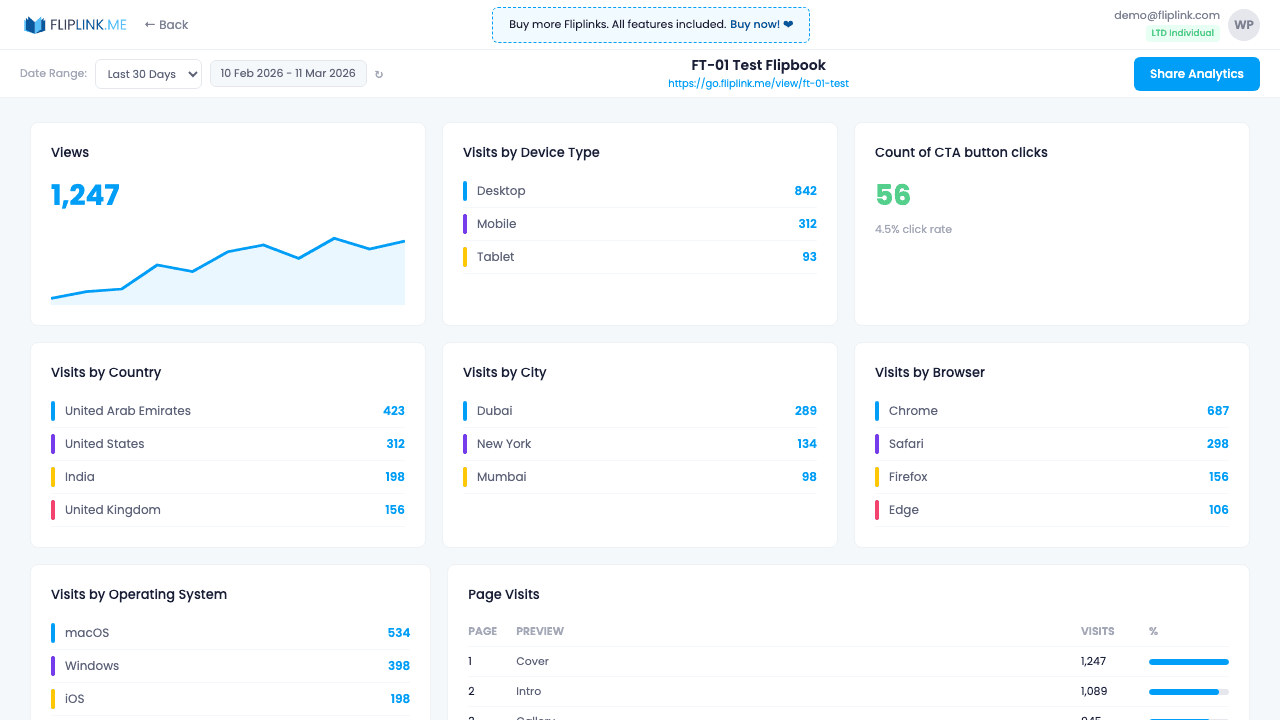
Track every interaction with granular detail. The analytics dashboard shows views over time, unique visitors, average session duration, device and browser breakdown, geographic data (country and city), traffic referral sources, and per-page view counts that create an engagement heatmap. Generate a shareable analytics link — optionally password-protected — for clients and stakeholders.
Ce qui est inclus
Views over time chart
A visual chart showing daily, weekly, or monthly view trends so you can spot engagement patterns and measure campaign impact.
Device and browser breakdown
See exactly what devices (desktop, mobile, tablet) and browsers your audience uses to optimize their viewing experience.
Country and city stats
Geographic breakdown shows where your viewers are located — invaluable for regional marketing and audience understanding.
Page-level view counts
Track how many times each page is viewed, creating an engagement heatmap that shows which content resonates most.
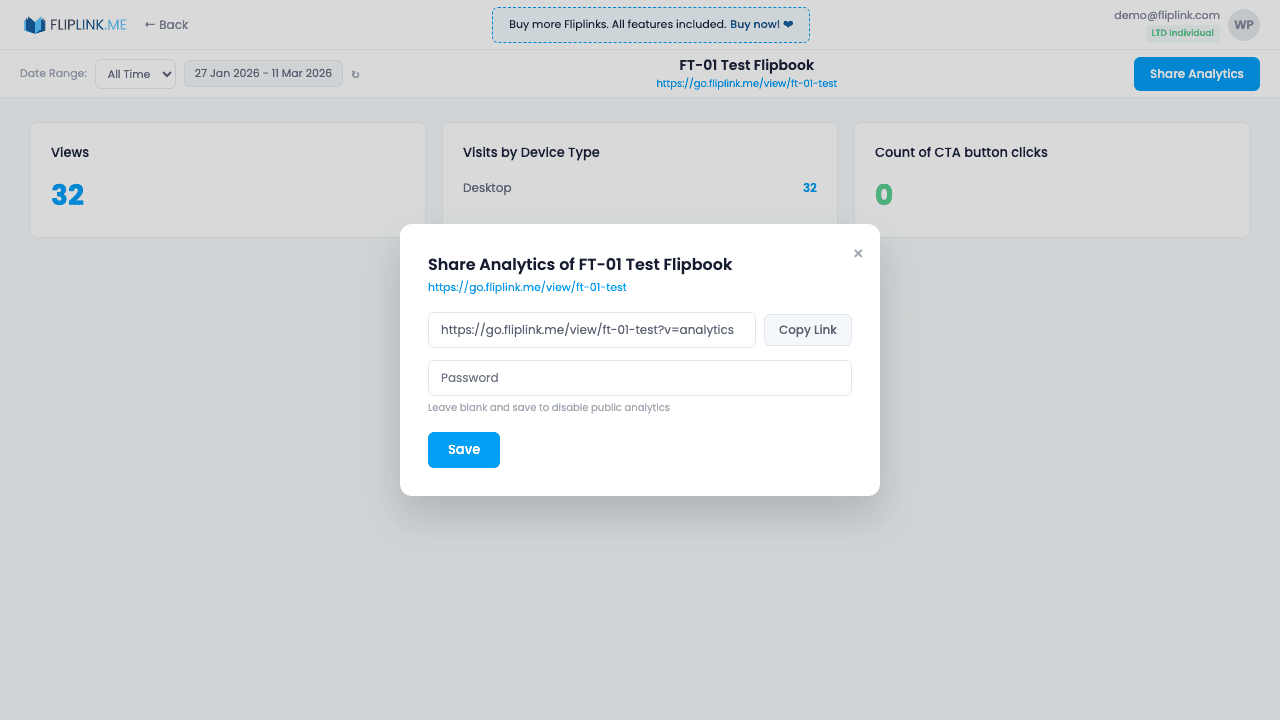
Shareable analytics link
Generate a password-protected link to your analytics dashboard that clients and stakeholders can view without a FlipLink account.
Free: Pdf To Flipbook
Turn your PDF into a beautiful 3D page-flipping flipbook.
Try it free — no sign-up neededEssaie Statistiques et analyses gratuitement
Toutes les fonctionnalités incluses dans l'essai gratuit. Sans carte bancaire.
Fonctionnalités associées
Suivi de documents — Statistiques et analyses in action
See how Statistiques et analyses powers per-page reader analytics for sales decks, proposals and contracts.
Paie une fois, utilise pour toujours
10, 50 ou 100 flipbooks · Les 35 fonctionnalités · Domaines illimités
Aucun palier. Aucune restriction de fonctionnalité. Chaque code de l'offre à vie débloque tout.
- Chaque fonctionnalité débloquée — sans limites
- Cumulable — achète plus de codes quand tu veux
- Remplaçable — échange l'ancien contre le nouveau
- Domaines personnalisés illimités (CNAME)
- Aucuns frais récurrents, jamais
Questions fréquentes
What analytics does FlipLink track?
FlipLink tracks views, unique visitors, time spent reading, device types, geographic location, referral sources, and per-page heatmaps showing which pages get the most attention.
Can I see which pages are most popular?
Yes. The per-page heatmap shows engagement data for each page, helping you understand which sections of your document get the most attention.
Is analytics available on all plans?
Yes. Analytics is included for all users — there are no tier restrictions or feature gates.
Prêt à transformer
tes PDF ?
Rejoins des milliers d'entreprises qui utilisent FlipLink pour créer du contenu interactif et engageant à partir de leurs PDF. Commence gratuitement — aucune carte bancaire requise.